
Introduction: Why first digits can reveal unusual patterns
In financial datasets, anomalies rarely announce themselves clearly. They hide inside thousands of rows of invoices, reimbursements, payroll entries, journal vouchers, or vendor payments. One practical way to spot suspicious patterns early is to look at the distribution of leading digits in numbers. This is where Benford’s Law becomes useful.
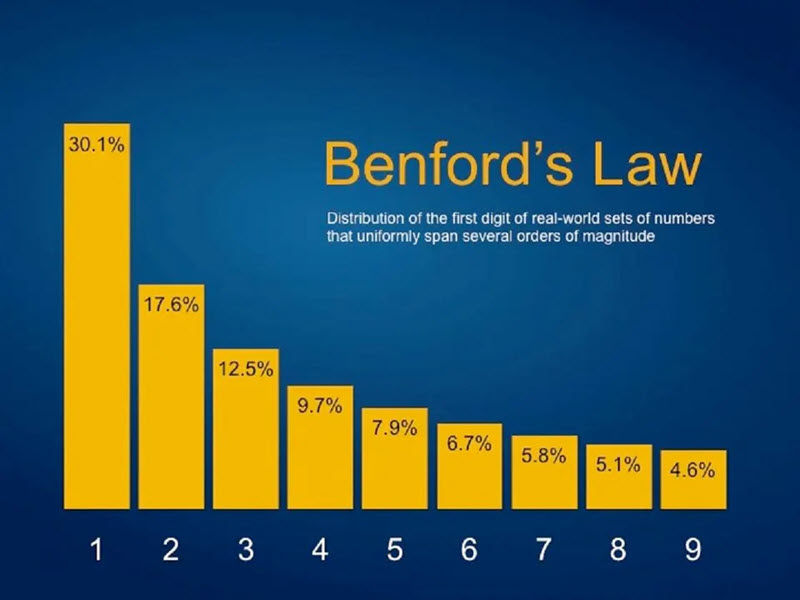
Benford’s Law states that in many naturally occurring datasets, the first digit is not evenly distributed. Instead, smaller digits appear more often. For example, numbers starting with 1 tend to occur more frequently than numbers starting with 9. When a dataset should follow Benford-like behaviour but does not, that deviation can be a signal worth investigating. For analysts building audit checks or risk flags—especially those upskilling through a data analytics course—Benford’s Law is an accessible technique that can strengthen data-driven decision-making.
Understanding Benford’s Law in plain terms
If a dataset spans multiple orders of magnitude (for example, payments ranging from ₹120 to ₹2,80,000), the first digits often follow a predictable pattern:
- 1 appears the most (roughly 30% of the time)
- 2 appears next (around 17%)
- the frequency keeps decreasing until
- 9 appears the least (below 5%)
This happens because real-world numbers often grow multiplicatively rather than additively. In other words, values do not increase by a fixed step each time. They expand and compress across ranges, creating uneven first-digit frequencies.
However, Benford’s Law is not a “fraud detector” by itself. It is a screening method. A mismatch does not prove manipulation, but it can guide you to where deeper checks are needed.
Where Benford’s Law works best in finance
Benford’s Law is most effective when the data has these characteristics:
- Large volume: hundreds or thousands of records
- Naturally generated values: not assigned codes or fixed pricing
- Wide numeric range: values spread across magnitudes
- No artificial constraints: not capped tightly or clustered heavily
Common finance use-cases include:
- Accounts payable amounts (vendor invoices, expense reimbursements)
- General ledger entries (journal line amounts)
- Sales transaction values (especially across varied products or geographies)
- Tax-related values (where figures arise from calculations across ranges)
Learners taking a data analyst course in Pune often encounter these examples in projects involving audit analytics, compliance reporting, or financial dashboards.
Step-by-step: Applying Benford analysis to a dataset
A clear workflow helps you use Benford’s Law correctly and avoid false alarms.
1) Choose an appropriate numeric field
Pick a field like invoice amount, claim amount, or payment amount. Avoid fields like customer IDs, PO numbers, or zip codes. Those are assigned, not naturally occurring.
2) Clean the data
Remove or handle:
- zeros and negative values (decide policy: absolute value or exclude)
- refunds that may distort distributions
- duplicate test entries
- currency formatting or text artifacts
Also consider filtering out extremely small values if they dominate due to rounding rules.
3) Extract leading digits
For each amount, take the first digit (and optionally the first two digits for deeper analysis). Example: 4580 → first digit = 4.
4) Compare observed vs expected distribution
Create a frequency table of first digits (1–9). Compare your observed percentage with Benford’s expected curve. The easiest initial view is a bar chart of observed vs expected.
5) Measure deviation
Instead of relying only on visual inspection, apply a simple metric such as:
- absolute difference by digit
- chi-square goodness-of-fit
- mean absolute deviation (MAD)
These help you quantify whether the gap is small (normal variation) or large (worth probing).
Interpreting results without jumping to conclusions
A Benford deviation should trigger questions, not accusations. Here are common legitimate reasons a dataset may not follow Benford’s Law:
- Pricing thresholds: many items priced in fixed brackets (₹999, ₹1999)
- Policy limits: reimbursements capped at a maximum amount
- Rounding behaviour: heavy rounding to nearest 100 or 1000
- Seasonality: repeated amounts during a campaign period
- Small sample size: too few records to stabilise the distribution
The best practice is to use Benford flags as an entry point for deeper checks: drill down by vendor, department, employee, approver, location, or time period. This is where a strong data analytics course background helps—because the next steps involve segmentation, hypothesis testing, and contextual reasoning.
Conclusion: A practical anomaly screen for modern analysts
Benford’s Law is a simple but powerful method for detecting unusual digit patterns in financial datasets. It is not a replacement for audits or investigations, but it is an efficient way to prioritise what to review first—especially when time and attention are limited. When applied carefully (right data, proper cleaning, and sensible interpretation), it can strengthen your anomaly detection toolkit and improve financial data quality checks. For professionals sharpening their skills through a data analyst course in Pune, Benford analysis is a practical technique that connects statistics directly to real operational risk and governance.
Contact Us:
Business Name: Elevate Data Analytics
Address: Office no 403, 4th floor, B-block, East Court Phoenix Market City, opposite GIGA SPACE IT PARK, Clover Park, Viman Nagar, Pune, Maharashtra 411014
Phone No.:095131 73277